I've updated my what I call "informational comment plug-ins".
They are three plugins meant to be applied together in sequence.
I usually run these after I run my "Extra Pass" (cleaner fixer) and "Class Informer" (if the target has C++ Run Time Type Info).
>> Sourceforge: Function String Associate>> Sourceforge: Mark Reference Counts>> Sourceforge: WhatAPIsIt's easier to express what they do in "before and after" images.
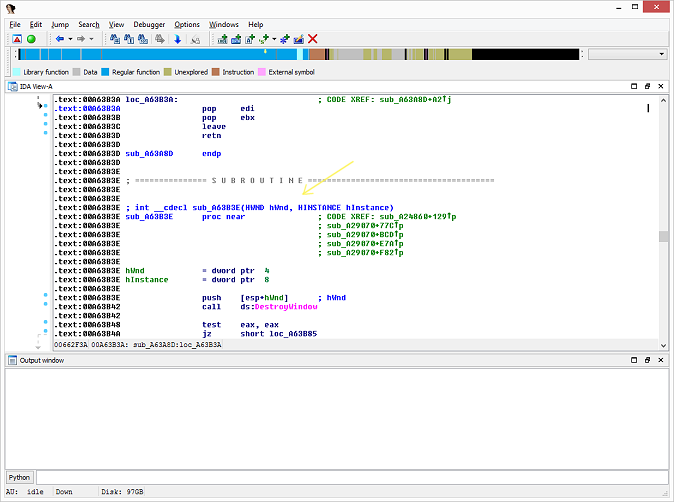
Here (the "before") you have a fairly common IDA Pro 32bit function example:

Pretty cool that IDA was able to derive the function arguments, but other then that
it probably won't look that significant to you.
Then looking at at a reference it looks even less significant out of the typical thousands of auto-named functions:

Now the three plug-ins ran in sequence:
1) Function String associate
2) Mark reference counts
3) WhatAPIs
(If you don't run them in this way the comment order will be messed up)
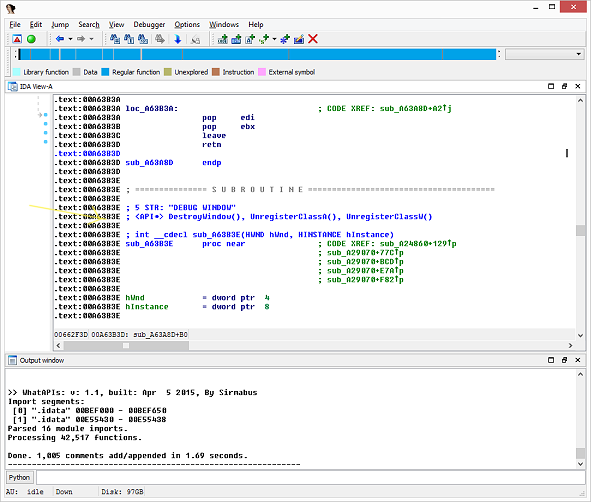
Now at a glance you see there is extra information about this function's contents:

Here's the break down:
First you see a '5'. This tells you there are 5 references to this function.
The count can give you some hints about the relevance of a function and some idea of it's hierarchy.
If it were just '1' count then you'ed know it's a child of your function; then say if it had 1000 references you could assume
that it might be some kind of common library function.
IDA function reference count to comment plug-in Blog PostThen you see the tag "STR:" which indicates that what follows are strings found in function.
In this case there is a string contained in it "DEBUG WINDOW". We can use this as a hint as to what the function might
might be about (literally a "debug window").
Then finally you see the tag "<API*>". This lists API functions (from the import table) that this function is using.
More hints.
From the string above and the fact we see windows UI creation functions, eureka! This function is probably
in fact one that creates a "debug window". Not even looking at the function we can just glean this from these comments alone..
Then look at a reference (one of the five) to this very same function:

All that information is visible even as a reference!
The reference count comments are also placed for data items.
So now as you are looking through functions and see their data references, and, or, directly at variables in a data segment
you can get some idea of their significance.
If you see some constant or dynamic data element with only one or two references you can infer (a hint) that it's probably not
that significant. But then on the other hand you see what looks to be a pointer value with 10,000 references then you can make
some assumptions that it's an important data item.
After while this extra info will feel natural, useful, and intuitive.
To me it's a world of difference. If I look at a plain IDB now with out this I feel sort of blind.
[The future]
Hopefully you will find these information comments useful. However it does have some problems and is not the ideal setup.
For one thing it might be harder to pick out your own comments with these placed.
Then if you accidentally overwrite a comment set with your own you'll loose them. You can't just run the plugins again to replace them (it will cause a mess).
If you use
BinDiff or the open source
Diaphora to port over your comments from one IDB to the next then that can make a mess of these comments too.
And what if you want to add your own auto-generated comments?
If nothing else they are handy for a debugging or development feature; similar to how people set the background color for the same purposes.
Too many function and data comments will become visual noise.
What would be ideal here to use a custom view!
Then these comments could show up more natively like IDA's own on the fly cross reference (light green colored) comments.
With this type of setup this data can be globally switched on and off, the text could be custom colored, users could add there own per function and data item text (through another plug-in or via Python bindings, etc.) and can optionally be persistently stored inside the IDB.
This view will look pretty much the same as the IDA "Disassembly" view your already familiar with, it'll just show extra information above the function header, below any exiting comment(s).
Finally the data could be ported over from one IDB to another by using names or better, be added to the port tool functionality it's self.
[May 2015] Updated to IDA 6.7 and now there are 64bit versions as well.
Downloads and Source:>> Sourceforge: Function String Associate>> Sourceforge: Mark Reference Counts>> Sourceforge: WhatAPIs